And indeed that’s true. Measured by its Sharpe ratio, Bitcoin comes in fourth. So, what sector was on top?
Real estate.
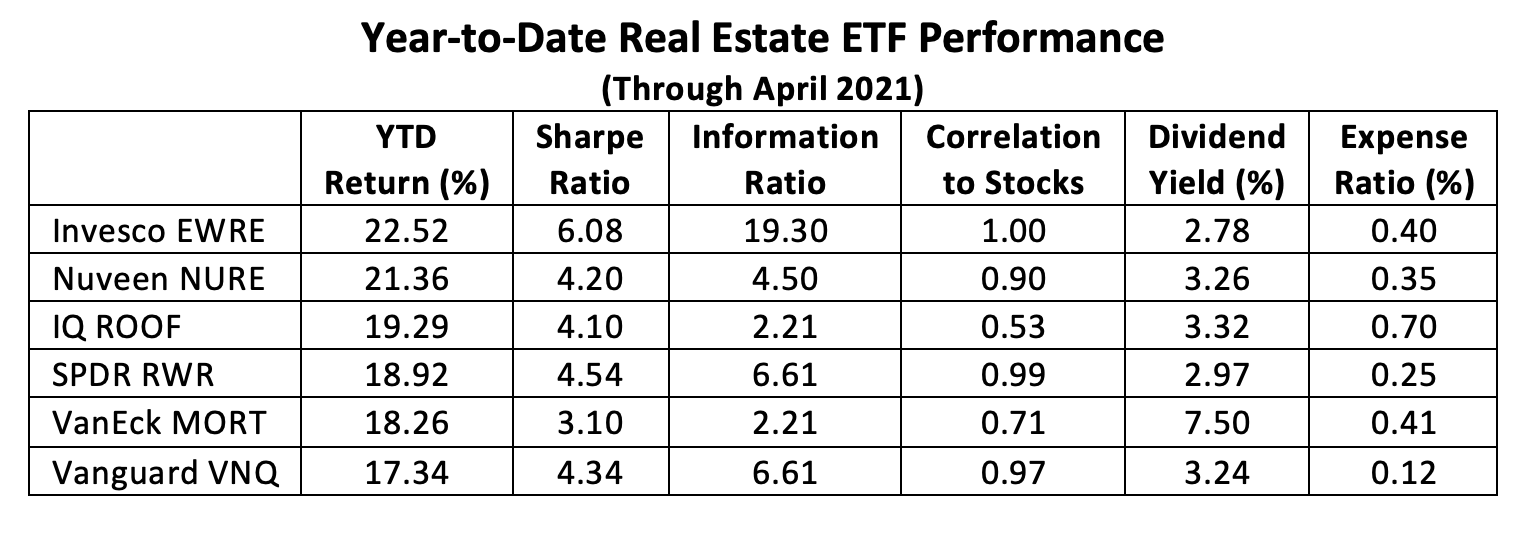
That’s reflected in the performance of 28 real estate exchange traded funds which have appreciated 15%, on average, through April with a mean 3.41 Sharpe ratio.
Most of the assets—fully 56%—are concentrated in the Vanguard Real Estate ETF (VNQ), a broad-based and cap-weighted portfolio of 175 constituents that attempts to represent the entire U.S. real estate sector. A third of VNQ’s weight is given over to large-caps. With only 20% devoted to small-cap entities, mid-caps represent nearly half of VNQ’s heft.
The Vanguard portfolio appreciated 17% in the first four months of the year, earning a 4.34 Sharpe ratio.
Given the SPDR S&P 500 ETF (SPY) earned a contemporaneous 12% return and a 3.56 Sharpe ratio, VNQ’s performance doesn’t look half bad.
What looks better than half bad, though, are the real estate ETFs that overweight smaller outfits. Take the Invesco S&P 500 Equal Weight Real Estate ETF (EWRE) for instance. Equal-weighting lightens the impact of the largest real estate investment trusts (REITs) in the portfolio. Seventy-five percent of the portfolio’s 30 REITs are mid-caps; the balance are large-caps. If the underlying S&P 500 universe didn’t exclude small-caps, EWRE would no doubt tilt much smaller.
EWRE clocked a year-to-date appreciation bettering 22% with a 6.03 Sharpe ratio, making it the best-of-breed real estate ETF. Given its lowly 0.07% market share, however, much of EWRE’s light is still hiding under a bushel.
Not too far behind is the Nuveen Short-Term REIT ETF (NURE) which focuses on 35 REITs with short-term lease agreements held by apartment buildings, hotels, self-storage facilities and manufactured homes. Seventy-two percent of NURE’s portfolio are mid-caps; 23% are small-caps. Only 5% of the ETF’s weight comes from large-caps.
For all that, NURE racked up a gain of in excess of 21% through April with a 4.20 Sharpe ratio. The Nuveen fund’s market share, at 0.05%, is even smaller than EWRE’s.
If you really want small-cap exposure you could do no better than the IQ U.S. Real Estate Small Cap ETF (ROOF). ROOF scouts the bottom 10th percentile of domestic REITs (by capitalization) for its 82 constituents, then cap weights the mix.
ROOF rose more than 19% this year while earning a 4.10 Sharpe ratio. ROOF has garnered a 0.08% share of the real estate ETF market.
The SPDR Dow Jones REIT ETF (RWR), as an elder fund, owns better than 2.5% of the real estate ETF market. A market-cap-weighted basket of 115 U.S. REITs, RWR devotes 54% of its roster to mid-caps, while large-caps and small-caps each account for 23%.
For the year, RWR has appreciated nearly 19% with a 4.54 Sharpe ratio.
Only one mortgage REIT ETF reached the top five this year. Still, that’s half of the mortgage REIT ETF universe. The VanEck Vectors Mortgage REIT Income ETF (MORT) is decidedly a dividend play. It yields 7.5% currently, better than twice the payout from the other ETFs on the list. For the record, about two thirds of MORT’s 25 constituents are small-caps, the balance being mid-caps.
All that resulted in a year-to-date gain exceeding 18 percent and a 3.10 Sharpe ratio.
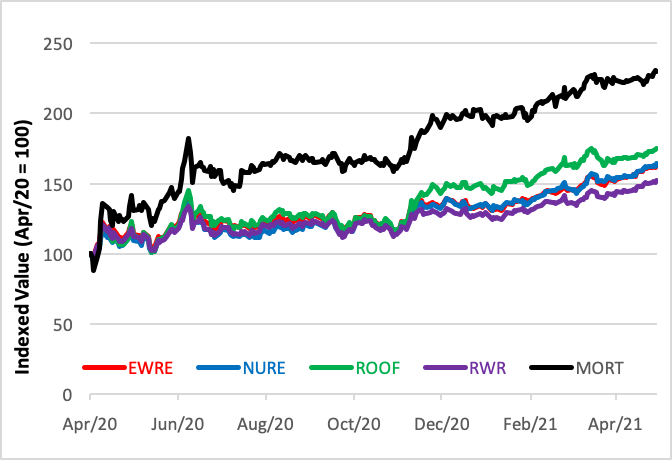
2021’s Top Five Real Estate ETFs
(April 2020 through April 2021)
What can we take away from these observations? Most apparent is the resurgence of small-caps. A tilt toward smaller and mid-sized REITs definitely paid premiums this year, reflecting the trend in the broader equity market. Unfortunately, those premiums have gone mostly wanting. The combined market share of the top five performers–averaging a four-month gain of 20% and a 4.40 Sharpe ratio–is barely over 3%.
The five biggest REIT ETFs take up 74 percent of the sector’s assets and produced an average year-to-date gain of 17 percent with a 3.87 Sharpe ratio. And, as we’ve seen above, the biggest of the big five, the Vanguard VNQ fund, devotes only a fifth of its portfolio to small-caps, less than half the space allotted by our five top performers.
Clearly, in 2021 small is bigger.


